This week we had the chance to create our first infographic in the IT&DML program. At first this appeared to be a daunting task, as I have never created an infographic before and had no idea how to start one. An infographic is a visual image that represents data and information in a creative way.
The task we were assigned was to create an infographic of a topic we feel would be of importance to educators. I decided to choose Benefits and Best Practices in Blended Learning as my topic. With the widespread use of technology among young adults, more districts are moving toward this model of instruction, which combining traditional teaching and learning with the use of online and digital tools to enhance the learning experience for students.
The infographic maker I chose was Piktochart, and boy did I have a big learning curve using this site. I must have spent two hours just trying to fix the sizing of each block so that they were all proportionate to one block per page. This would be my biggest criticism of this site as it was pretty easy to insert text and media, but when it came to formatting the height and width of each block each time you added a new one, it became one difficult process as it kept bringing the previous block onto a preexisting page. If I create an infographic in the future, it is safe to say I will be choosing a different site.
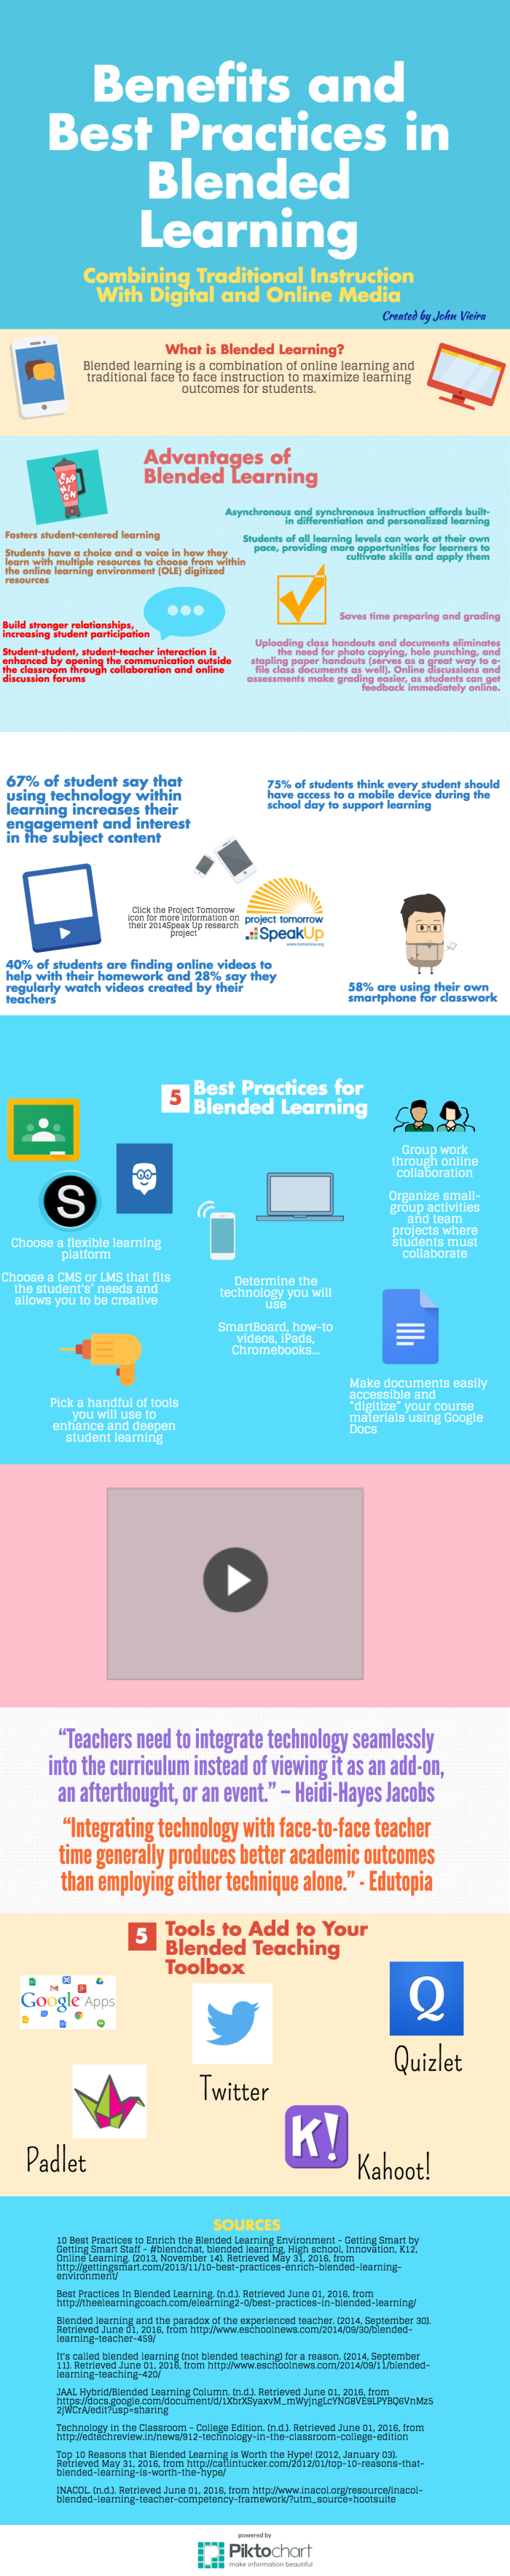
Click on the following link Infographic: Benefits and Best Practices in Blended Learning to view the full infographic and its links and video.
Reflecting on the infographic as a whole, I would say that this is an extremely authentic tool to utilize in class, utilizing the Redefinition level in the SAMR model. Having students create an infographic allows them to take their knowledge of a subject to a new level, beyond the traditional essay or research paper. Students can creatively show their knowledge on a topic by including several forms of multimedia to display their understanding of a topic, and teach it to their peers.
As I was completing this project so many ideas were going through my mind about how I will utilize this in my classes next year as a means to evaluate my students in a more creative yet authentic way. I thought the rubric that our Professor, Laura Greenstein, provided made it very clear as to the expectations of the assignment. I hope she doesn’t mind, but I will be remixing this rubric with my high school classes next year. This type of assessment is a great way to assess student understanding of curriculum standards as they are covered throughout a course. I am glad I was able to create my own infographic and experience the creative possibilities making an infographic brings.
-John V

John I love this! I think you struck a great balance between images and text. This infographic is a manageable amount of information to digest, especially for someone new to the idea of blended learning. Great job with the video selection as well. It adds a nice touch and summation at the end.
LikeLiked by 1 person
John-
I agree with you about the rubric. It was too easy to get lost in the tech and forget the mission. When I use infographics with my students I am going to be certain to start with a rubric, chunk the assignment and to check in with the rubric, finish with a peer/self assessment before students can submit to the teacher.
LikeLiked by 1 person
John, I think you have a real knack with choosing images; I see it on the infographic here, and on your blog posts too. This will prove to be real asset for your learners. I also appreciate all the links. These features make your inforgraphic more than just a visual aid. It can serve as a gateway post to the topic. Wish we could have used it in our module from the previous semester…
Nice work!
LikeLiked by 1 person
So glad to hear that this was an authentic learning experience that you will be able to use going forward: (but perhaps with a different technology in your classroom:) I agree that synthesizing information is a valuable “real world” application and like how you created an infographic that was easy to follow and very informative. The linked video extends the viewers understanding and numerous sources leads them towards further learning. A rubric will be send via gmail.
LikeLiked by 1 person